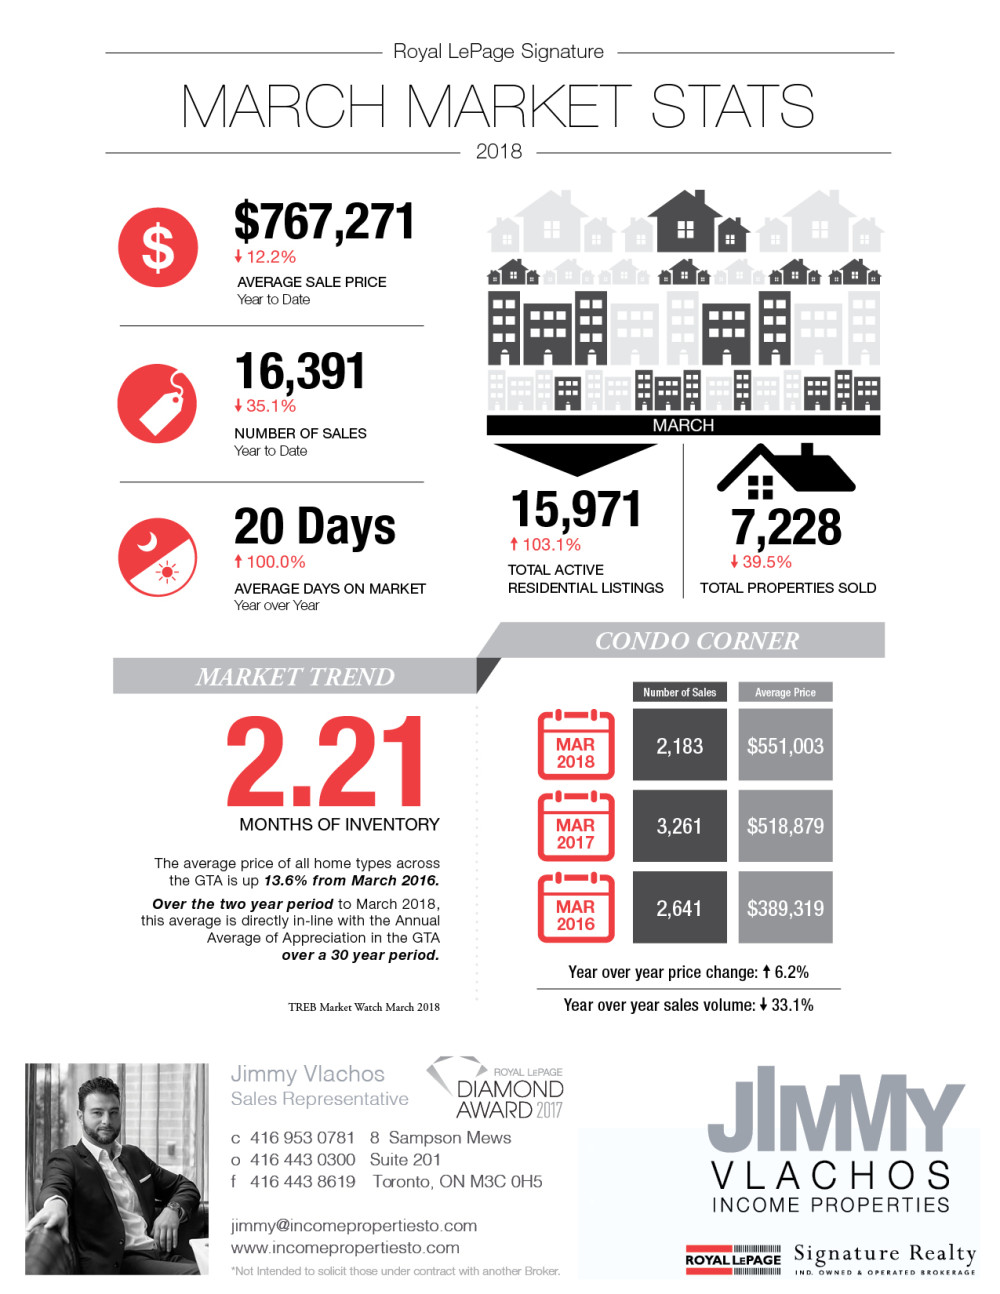
MARCH MARKET STATS 2018
Hello Hello,
I hope all is well and you enjoyed the brief glimpse of spring weather yesterday afternoon.
I wanted to take a moment to update you as to whats actually happening within the different sectors of Toronto’s real estate market. The market is hot. The message presented by the media is Toronto’s real estate prices and sales are down from last years highs.
To quote Denzel Washington
“If you don’t read the newspaper you’re uninformed, if you read it you are misinformed”
Here’s the real deal:
- Bully offers (offers presented before the multiple offer date) are boss. Seller are willing to look at offers prior to the multiple offer date and homes are selling for record prices. Well finished homes in premium locations are now selling for 120% – 140% of the asking price in 2 to 3 days.
- Due to the 20% stress test demand for properties priced between 749k to 1.2m have see a huge spike in demand as purchasers in the city to Toronto continue to compete for properties.
- The strongest conditions were found in the City of Toronto and Peel Region in February, as buyers continued to seek out prime locations and relatively affordable housing close to Toronto. Markets with larger and higher priced homes outside of Toronto in York Region, and to a lesser extent Halton, exhibited oversupplied conditions.
- Condo price growth has outstripped detached prices, the price gap between the two housing types has narrowed to its smallest margin in two years. While the gap in pricing remains enlarged from an historical context, the fact that detached prices have recently become more affordable on a relative basis may encourage a rise in demand for this housing type in the coming months.
- Supply is currently lowest for condo apartments at only 1.7 months of inventory, indicating further upward pressure on prices in the near-term. Inventory levels for condos were lowest in the City of Toronto (1.5 months) and in Peel (1.4 months), where the stock of condos in Mississauga City Centre has grown to nearly 15,000 units.
- The TREB district with the highest average ratio of sales price to list price was
E01 at 107%, representing the popular family-friendly neighbourhoods of Leslieville and Riverdale with a high concentration of semi-detached houses. Other east end districts such as E02 and E03 also had a high ratio of 103%, while the west end districts of W02 and W01 (The Junction-High Park- Roncesvalles-Parkdale) ranked higher with ratios of 105% and 104%, respectively.
I believe that as prices and pressure increases in Toronto demand will spread north as purchasers look to escape competition and affordable options. If you’re looking to buy outside of the City of Toronto now is the time.
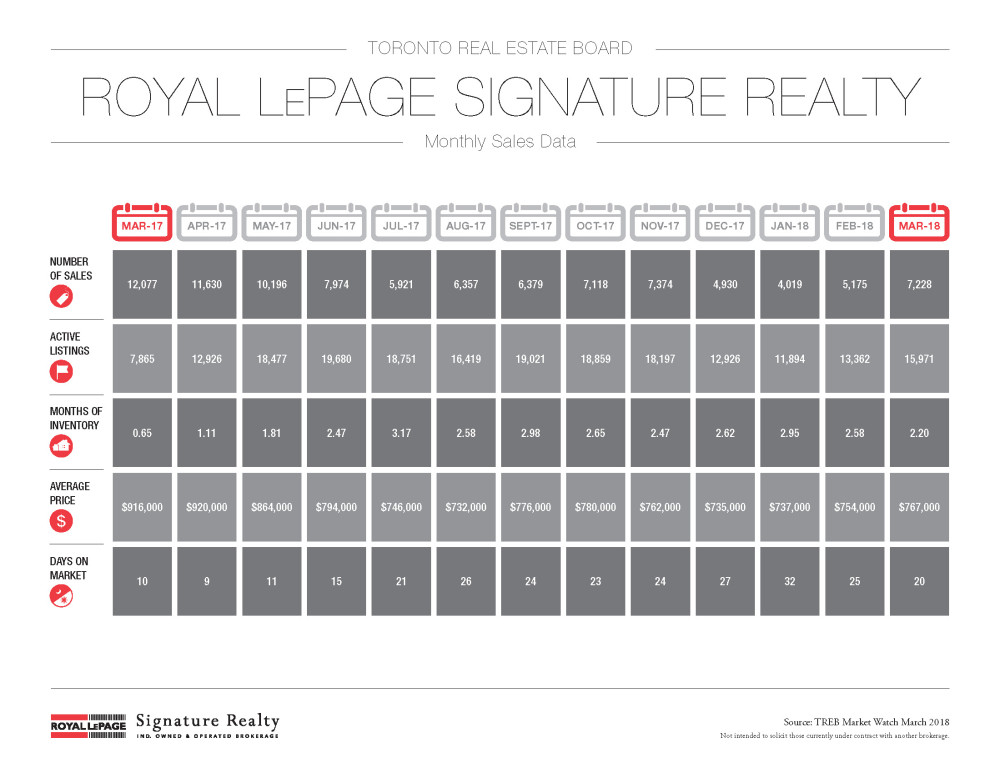
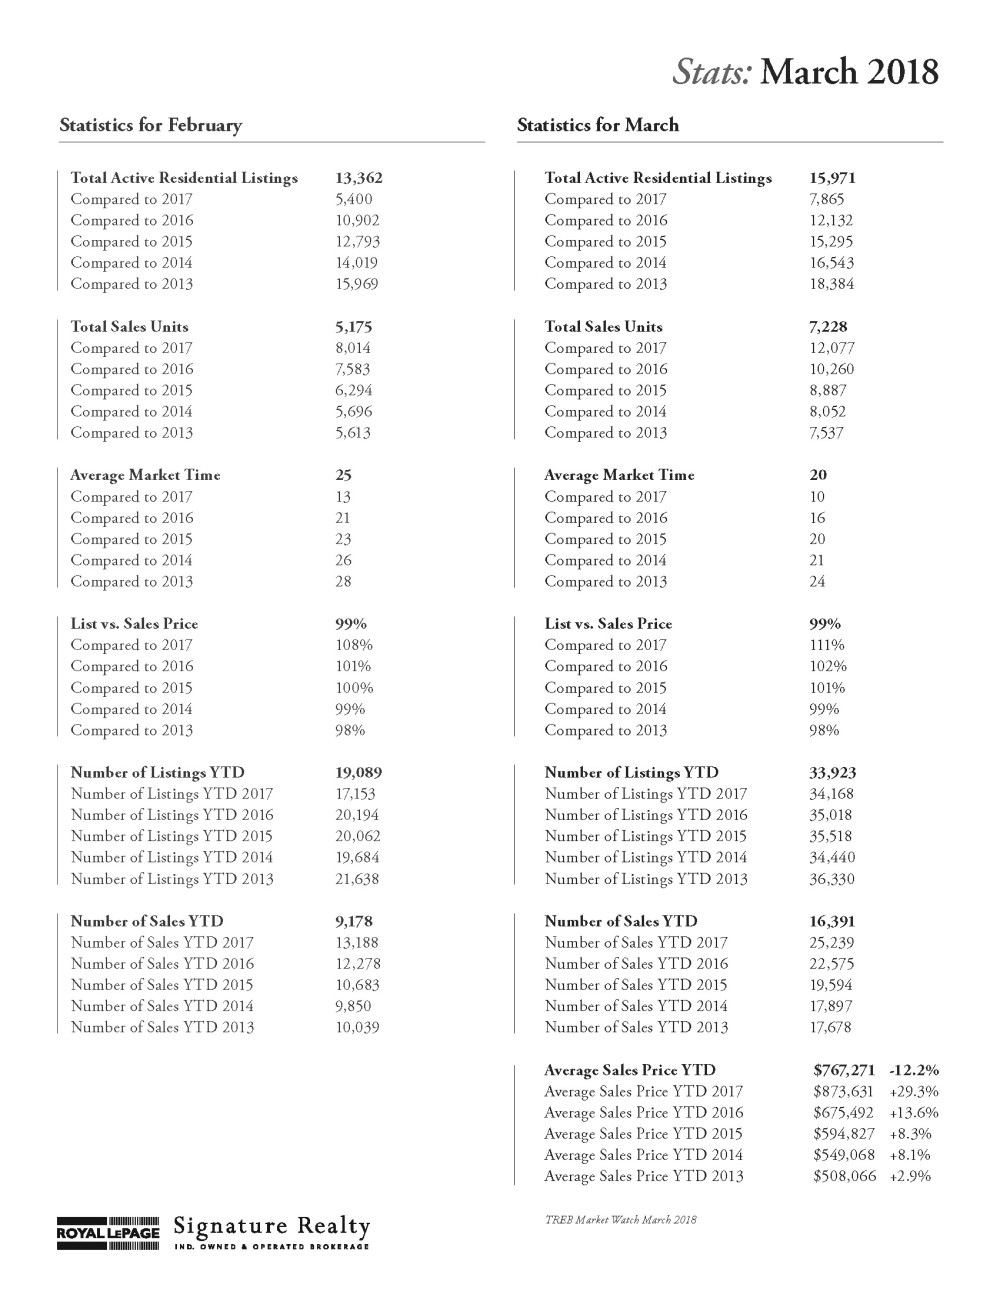
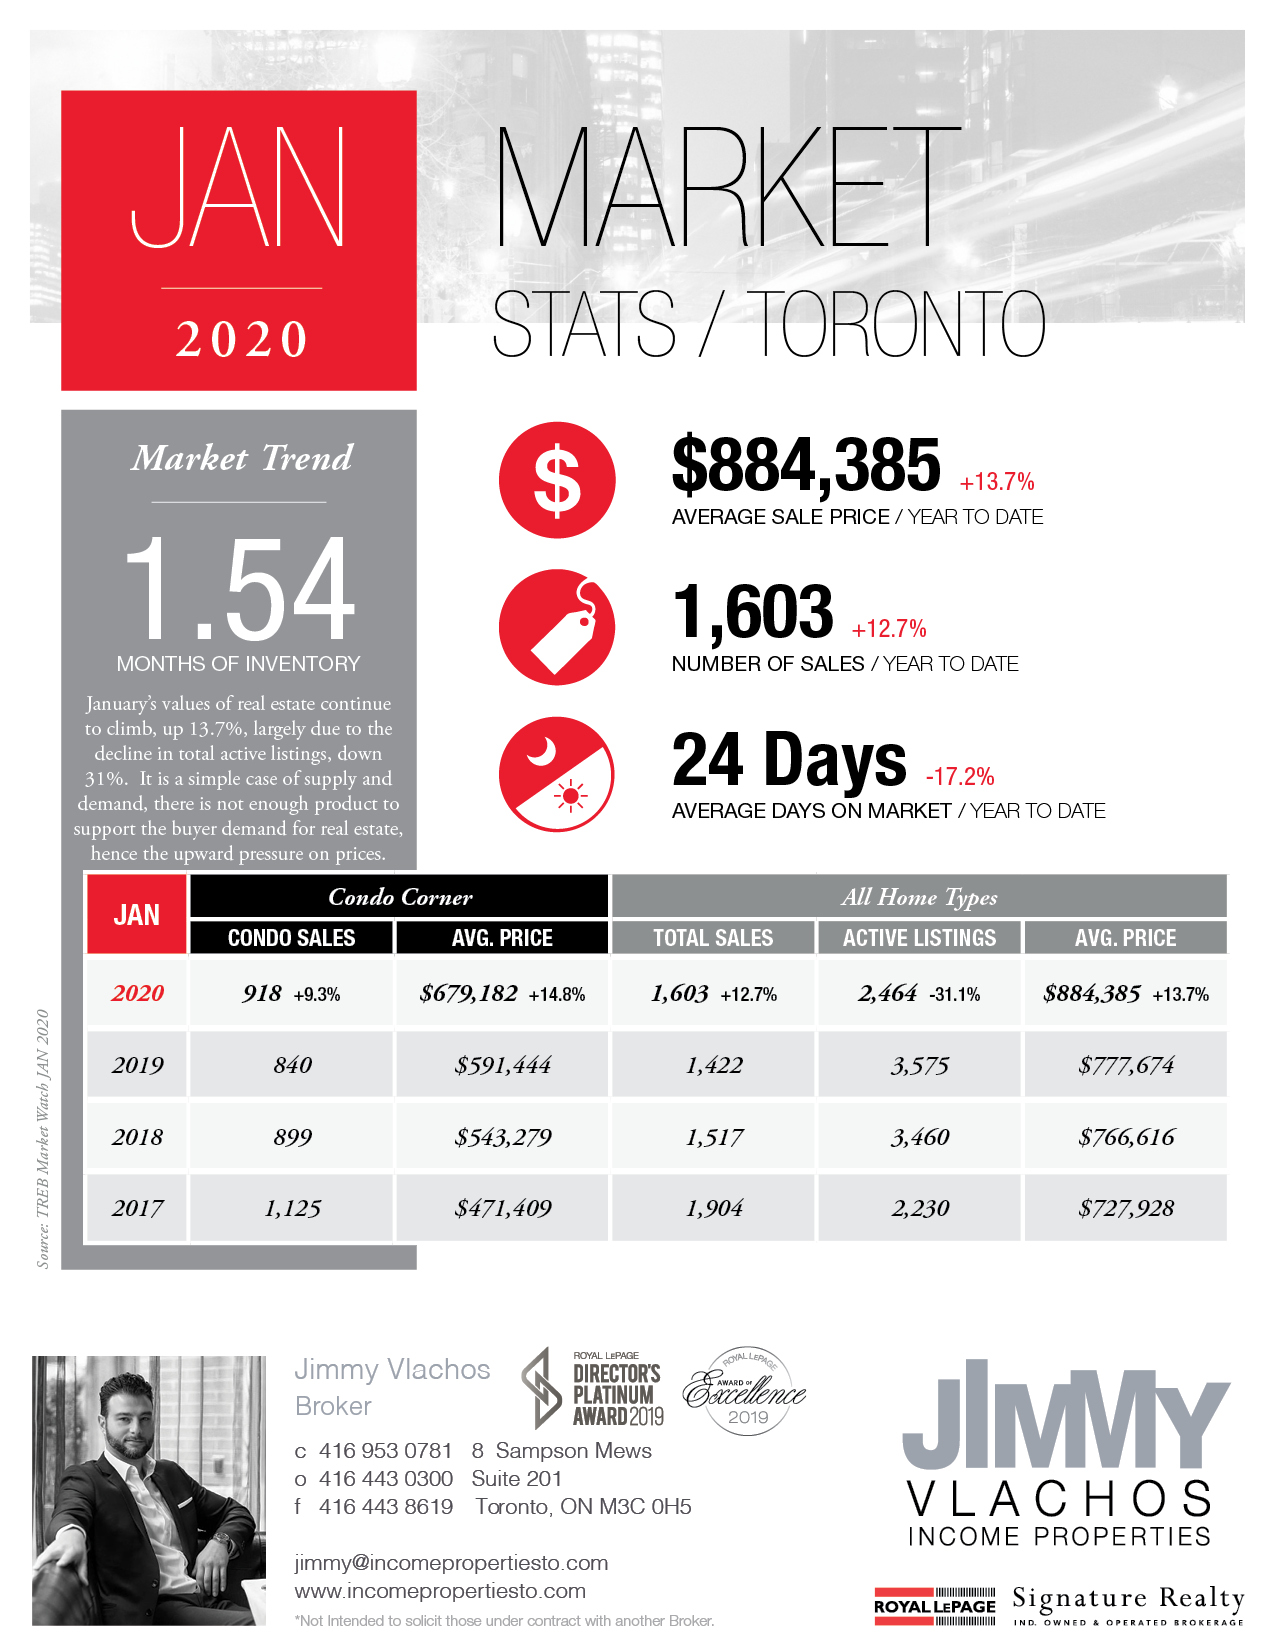
I’ve attached the March Real Estate Statistics along with historical data for your review. Keep in mind the data in the charts is for the GTA. Click on images to see full page.
If you have any questions or would like a copy of our detailed market report please let me know. If you’re looking to buy or sell or know someone making a move let me know… I’m never too busy for any of your referrals.
Talk soon!


Comments are closed here.